20+ Tools to Create Your Own Infographics
Infographics are a great way to show data without making it boring for your audience. Many people have valuable data, but they aren’t sure how to make clear and well-made infographics.
Good news! There are plenty of infographic tools that let you make colorful charts and pictures quickly and easily. Here’s our list of more than 20 tools to help you create awesome infographics fast.
Read Also: 40 Free Infographic Templates to Download
1. Canva
Canva provides useful tools for designers, including one for infographics. There are loads of templates and more than a million stock photos you can use. Plus, you can even add your own pictures.

2. DocHipo
DocHipo lets you make eye-catching infographics quickly.
Choose from a big collection of well-made infographic designs. After picking a design, you can change it the way you want with a simple editor. Change the color, write your message, and add cool drawings, stickers, moving pictures, or other design things to make a great infographic.
When your design is done, you can download it in different formats like JPG, PNG, PDF, MP4, or GIF and use them when you’re not online. Or, share them on your favorite social sites straight from DocHipo.

3. Piktochart
Piktochart is known for its great tools to make lively charts and maps. You can make moving charts with symbols, text boxes, styles, and your own photos and videos.

4. Creately
Creately is a picture-making tool with useful features to make more than 50 different types of pictures. Plus, you can work with others to make the best images.

5. Visually
Visually doesn’t have infographic tools of its own. Instead, it puts you in touch with top designers who can help you with infographics for a good price.

6. Medialoot
Medialoot offers many tools for designers. You can download them one by one or get them all with a monthly payment. They have lots of icons, fonts, mockups, and graphic tools you can use.

7. Adioma
Adioma is a clever infographics tool that makes lively infographics from the data you give. It uses smart AI that gets better the more you use it.

8. Graphs.net
On Graphs.net, artists share their infographics so others can use them at no cost. You can look for graphs by kind, group, or how popular they are.

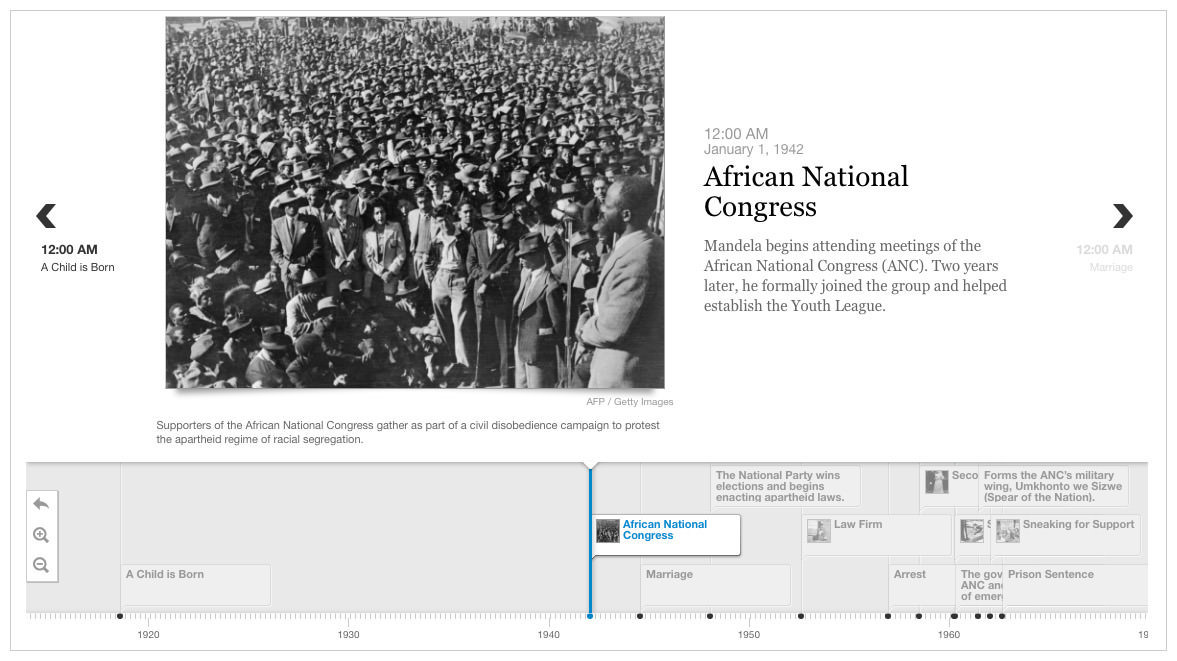
9. Timeline JS
TimelineJS is a free and simple tool that lets you make lively and nice-looking timelines using just a Google spreadsheet. With it, you can show events and happenings in the order they took place.
10. Infogr.am
Infogr.am makes adding your data simple with several ways to do it, including the option to connect to live data. You can pick from over 35 chart designs to make amazing infographics.

11. Cacoo
Cacoo is a full diagram tool that lets you make Flowcharts, UML Diagrams, Network Pictures, and Sketches that interact.

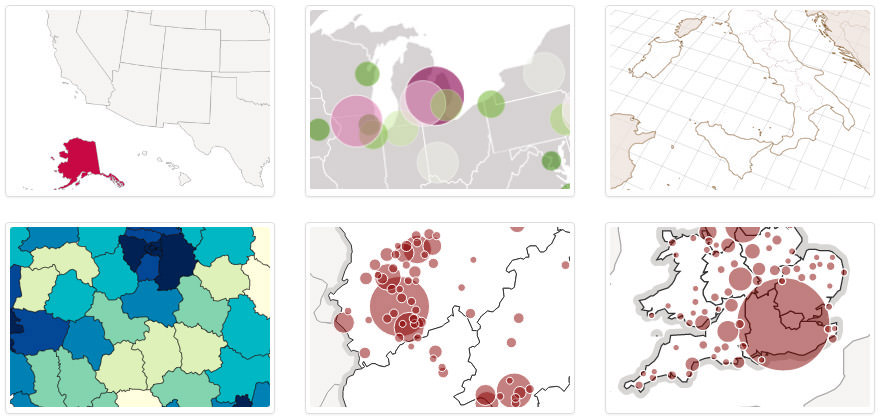
12. Kartograph.org
Kartograph is a top free tool for making drawn and interactive maps. It uses Python and JavaScript to help you make the maps you need.
13. Kinzaa
Kinzaa offers a simple guide to help you make infographic resumes and interactive pages for websites.
How to Craft Professional Resume with ChatGPT
Why write a resume from scratch when you can leverage the help of machine learning? Read more

14. Visme
Visme lets you make interactive infographics using pictures, widgets, shapes, and symbols. There are also pop-ups and moving features to make your infographic look great.
15. Google Data Studio
Google provides this useful tool for showing data to make interesting boards and reports with pictures and charts. It also lets users get data from other Google services, like Google AdSense.

16. Easel.ly
Easel.ly has nearly a million free photos and infographic designs for making infographics at no cost. You can also ask their designers for help or watch webinars to get ideas.

17. Vizydrop
Vizydrop is no longer available.
Vizydrop is a free tool that shows data automatically and suggests interactive charts based on your data type, filling in the data by itself. You can add data from different places, and Vizydrop lets you change the data however you want.

18. ArcGIS Infographics Add-on
This is an add-on for the map-making tool ArcGIS used on computers. This add-on lets you put infographics directly on the maps so anyone can understand them better.

19. Edraw
Edraw is a tool for making infographics on Windows and Mac. It lets you make nice charts and maps. You can change everything you want and also draw using its tools.

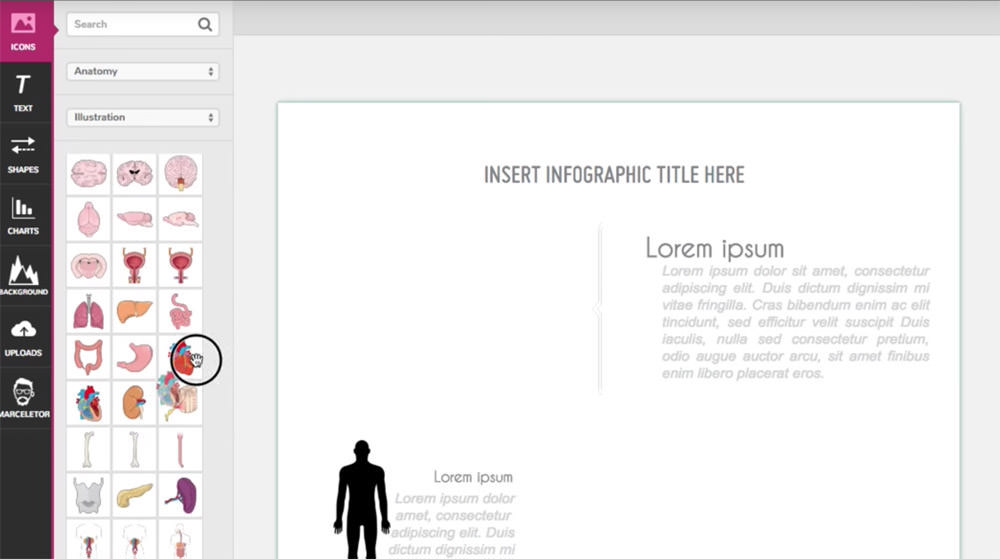
20. Mind the Graph
Mind the Graph has tools for drawing for lessons and projects including science pictures, charts, and graphs. You can make infographics yourself or ask for help when you need it.
21. Icograms
Icograms is still being tested, but it has some really advanced tools for making infographics. You can draw diagrams, maps, and charts with ready-made designs and symbols, or use your own pictures. The infographics also look really sharp with perfect pixels.

22. Icon Archive
Icons are key for making an infographic, and Icon Archive has one of the biggest collections of icons. You can find both free and ones you have to pay for here.

Other Infographic Tools
Here are more tools that might be useful when making infographics.
- Tagxedo – Tagxedo is a tool that makes word clouds automatically. It gives you different options (like themes and fonts) to show your data as fun word clouds.
- StatPlanet – Show your data with moving graphs and maps using StatPlanet. When you add your data, it makes infographics with maps, timelines, charts, and graphs.
- Gliffy – Gliffy lets you draw flowcharts, Venn diagrams, mind maps, organization charts, network pictures, sketches, and technical drawings. You can also work with your team on them online.
- Charte.ca – Charts are key parts of infographics, and you can make them easily with Charte.ca. It lets you use moving parts and deep tools for navigation to make the best moving charts.