20 Basic Tips & Tricks to Master Google Analytics Data
Looking over and managing website visitor data is crucial to the success of your company. Whether you are running a new startup or a simple weblog, you should be keeping track of your visitors log. However, some webmasters might be looking at the wrong numbers and not analyzing them enough to form sound conclusions. By studying the right metrics you can learn a lot about your audience and what they need.
In this article I would like to present 20 tips into specific areas of Google Analytics for a more refined approach. Depending on your goals, it is possible to study how users are finding your website, where they are coming from, and how long they are staying on your pages.
All of this information can be too much to handle at once. So be sure you know the information you need and keep yourself focused on the end results.
Traffic metrics are the best stats for analyzing how your website is growing and which areas are most important. I hope some of these ideas may offer insight for garnering new marketing concepts to drive in more targeted visitors.
1. Long-Term Statistics
I want to start with a general idea to keep in mind as you examine each of the data stats pages. For each set of metrics you should consider both local values and long term values.
By default Google Analytics will display results from the past 30 days. This is good for studying your most recent pages and publications to see which topics have been thriving.
However by extending the graph to span out 3-6 months you’ll pick up on larger trends. You will be able to determine pages that are garnering the majority of search engine traffic, pageviews, and daily visits by users.
If you have been online for a while try extending your stats out to a year or even further!

Long term growth patterns are what you need to bring in new visitors over years of marketing. It is very pushy to rush out a website with content and expect massive results in a few months. The strongest method of growth is stability and keeping your website online the longest (when compared with the competition).
Being stable and reliable is something which will reward your efforts in the short and long term.
2. Examine Visitor Activities
Another thing to keep in mind is that you are not just looking at numbers based on pageviews or total visitors. You also want to know how many of those people are finding your content useful. Are they staying on each page for a significant amount of time? How many of the new visitors are leaving immediately?
You should pay careful attention to each value for Entrances, Bounce Rate, and % Exit.
The Entrances column will list the total number of visitors who entered your website on a certain page. This could be your homepage, or a blog entry, or something else which would get attention from readers.
The Bounce Rate and Exit percentage are very similar, with one defining factor. Bounce Rate will measure the number of users who landed on a certain page, then left without visiting any other pages. Exit percentage counts the number of people who left your site after visiting this same page, but they could have been browsing other pages beforehand.
Here is a brief article explaining the minor differences.
All of this information can be found in the same table as your other stats. Get accustomed to studying these numbers to understand what they really mean.
Most site visitors will only grab the info they need and leave never to return again. Offering the right content for their attention may entice them further explore your site before taking off. And by arming yourself with the knowledge of traffic statistics you can measure a fairly plausible success or failure rate.
3. Audience Locations
You may be surprised to learn how visitors are accessing your website from various locations across the globe. Google serves a lot of native countries with their regional language, and it is common to find yourself ranking within these foreign search results.
The map displays a percentage of total visitors who come to your site from a specific country or territory. The darker shades of green represent more visitors and more traffic from a certain location. You may be surprised at the sheer number of foreign visitors who find your website via search engines.

This data offers a sincerely practical use as well. You may find that a lot of traffic from another website is driving a new audience onto your blog or webpage. It may be worth capitalizing on this traffic through ads, or giveaways along with other related marketing ideas.
Additionally webmasters will sometimes publish translated content on their site. You may study these trends and determine how many visitors are using these translated pages compared to the originals.
4. Checking Web Browsers
HTML5 and CSS3 trends have pushed us further towards a more unified web, but we are not quite there yet. Plenty of websites online still do not support older browsers and even some modern ones too.
Google Analytics provides you with the following browser-related data about your visitors:
- Web Browser & version number
- Operating System
- Screen Resolution
- Flash/Java Version
To switch between these different statistics, click any of the links labeled “Primary Dimension” above the datatable. Here’s an example of how you can sort this data:

You may study your data and find that a majority of IE users abandon the website within the first few seconds. This could be caused by a bug in the layout, or some other effect of slow loading times. Studying the browser statistics and version number will help you track down which bugs need to be fixed and which browsers you want to support.
If your audience is comprised of > 90% CSS3-supporting browsers then you need not bother with any fallback methods.

5. Content with Popular Keywords
Your website may have a very small number of visitors, but chances are that most of them come from search engines. Have you ever wondered what keywords they typed that led them to your website? Or what are amongst the most popular keywords that lead most visitors to your website?
Of course, this information can be found in Google Webmaster Tools if you’ve added that to your website. Yet I believe Google Analytics can provide a much more comprehensive set of data.
While Google Webmaster Tools explains how your site ranks for specific keywords and how many visitors end up on your website (or page) with them, Google Analytics tells you ‘what’ they are doing on your site. You can study which pages they visit, how many pages they visit, and how long they stayed on each page. You can practically track every user action within Google Analytics and study the data to discover larger trends among visitors.

After understanding and analyzing which keywords visitors used and which pages they have visited, your golden question is probably: What can I do about it?
One idea is to learn how people search the Web, and then provide specific niche content not yet available using laser-targeted keywords. For example, when somebody searches Google for the keywords “IE6 rounded corners” there will be more results compared to “how-to IE6 hack CSS3 rounded corners”. The 2nd set of keywords is more complex and will return fewer results, but overall provides more helpful and targeted website rankings.
If a page on your website includes something very similar to these long-tail keywords then you will likely rank on the first page of results. Even better if the keywords are in your page title so they will appear bold in Google rankings.
6. Visitor Flow Charts
This feature is something not often seen mentioned in relation to Analytics. Not everybody will care exactly how their visitors perform but the information is much easier to digest.
The starting point is how each user entered your website and the first block is their landing page. The blue lines connecting blocks together represent users who landed on the first page and follow their chain for visiting other pages. You can study the flow of these lines to map out which pages a typical user will follow when visiting your website.
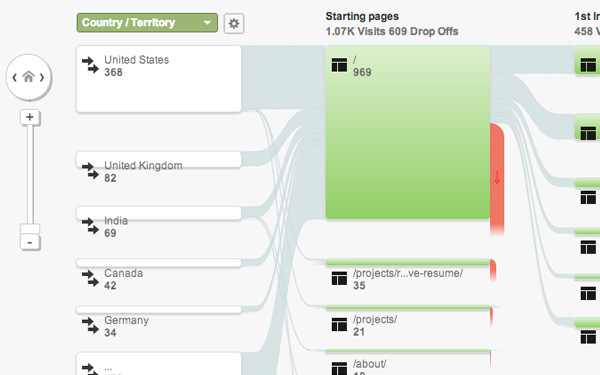
Initially you may feel a bit overwhelmed but the charts are supposed to be a little messy. You will notice thicker lines between page blocks if more users are following the same route. This may be visitors landing on a popular blog posts which leads them back to your home page, and then checking out your most recently published article.
The patterns are worth studying to see if you can duplicate any effects with similar content.
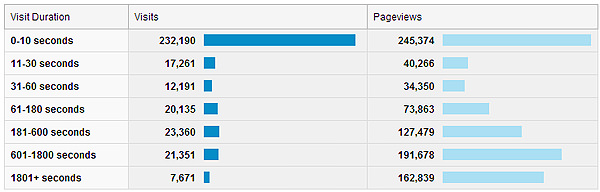
7. Study Engaged Traffic
Visitor engagement is measuring how many visitors are staying on your site for extended periods of time. Engaged visitors will likely stay for more than 60 seconds and often visit more than one page. Each visitor is measured for their time on the site and will be grouped together based on duration.
The table records unique visitors and their total number of pageviews based on the amount of time spent on your website.
You may consider studying the bar graphs found at the very bottom of the table. The last two rows measure visitors who are on your site for 10-30 minutes, or longer than 30 minutes. This data is important because these are the most engaged visitors out of all your traffic.
Check out the number of pageviews in comparison with the total visitor count. It is often true that although you will not find as many dedicated people on your site for extended periods of time, the people who do stick around visit a lot of pages.
8. Backlinks via Referrals
I look at referrals with a specific mindset of determining how my links got onto other websites, and if it is possible to continue building traffic from these domains.
Your referral stats both short-term and long-term will help you figure out which websites are sending you the most visitors. Now you will want to check the engagement of this traffic to see how long they are sticking around, and possibly how many pages they visit.
But in some cases the referral traffic is published on a website where you have some leeway. The social networking websites like Reddit and Hacker News are both large sources of traffic to web designers and developers. This is because the networks have communities based around design, programming, and general Internet trends related to startup culture.

However there are other situations where you are building traffic from a website that you did not publish or submit into. Think of things like affiliate links, blog posts, design galleries, and other situations where somebody else may have added your link onto their page.
In this scenario you do not have much ability to add more links but you could reach out to the owner/writer and say thanks for their backlink support.
9. HTTP Latency
Website speed is more important than you might assume. Nowadays Internet speeds are much faster than they have ever been, and company T1/T3 lines can push data even faster. This means if your web server is unable to handle traffic influx then visitors will eventually get fed up and leave.
You can determine a lot of ideas especially in the Page Timings graph, which details each page along with the total average loading time (in seconds).
Some pages with a lot of images or video content may take longer to finish than a blog post with static text. You have to consider the information in a broader sense to figure out where the problems pop up. All too often I see websites attaching links to 3rd party hosts for their JS plugins or CSS libraries.
There are scenarios when this technique saves time but it can also hurt your speeds if they go unchecked.
Related: How To Measure Front-End Website Performance

10. Driving Social Media
Social Referrals talk about websites which are generally built via user input. These may be tweets or Facebook posts, or also comment discussions on news articles or social media sharing websites. This data will provide some insight towards how much your fans are sharing links online, and how many people are clicking them.
The most popular landing pages are specifically helpful because you can determine which content is most organically interesting. Visitors are not required to share your links; they do so by their own choice of free will.
If you notice that a single page is garnering lots of attention from social media traffic then it may be safe to assume there is some natural attraction. Be sure to look back over months and possibly years to pick up on larger trends in the process.

11. Social Media Flows
Tip #10 on “driving social media” allows us to look into social traffic and find out which pages are getting the most attention. By looking into network referrals it is much easier to see where this traffic is coming from.
Also the social traffic data has its own flowchart page where you can see the original referring websites and their flow upon landing on your page: Traffic Sources > Social > Visitors Flow.
I believe that social media links are just as important as natural search engine traffic. We still live in a fairly infantile stage of social media where we are all attempting to connect via different networks and websites. And we have come a long way in the past 10 years from MySpace, Facebook, Twitter, and many others.

Now it is possible to find yourself with an influx of social media traffic over a week’s or a month’s period. Study the networks where your website is performing the best and try to keep people sharing & discussing your links.
As time passes this will follow the snowball effect and may potentially scale very large.
12. Goal Conversions
In the past we have written on goal conversions in Google Analytics. Not all websites will need to use these metrics but it is an important concept to understand.
When you have content which pushes visitors into engaging a specific action it is worth studying its success rate. You may need to fix up the landing page for a bigger impact.
Learning how to draw conversions is a big step in marketing your website. The goal may not be to sell anything, merely just to get users to register for your new forum or social networking webapp.
Goals are useful when you have a pre-defined course of successful actions you want your visitors to follow. The statistics captured by Google Analytics will only aid further in perfecting the art of creating helpful and enticing user interfaces.
13. Locate your Bounce Pages
People are mostly interested in the highest visited pages. But what about the pages which drive away the most traffic? Analytics data is good for picking out what you’re doing right and what you are doing wrong. When you have a page with 90% exits you know there is some reason people are not interested in digging deeper into the website.
Admittedly this is not so uncommon when you publish articles or pages on fairly offbeat topics. You never know where your audience will come from and it is difficult to please everyone all the time.
You shouldn’t get tied up scrambling to “fix” bounce rates as often times the content is just a mismatch with the website. It is still valuable content and people can still enjoy the posts without sticking around for more.

14. Reading AdSense Metrics
I have never personally connected my Analytics into an AdSense account but from the Google support guide the process seems fairly straightforward.
Analytics will help you determine which users are converting and processing clickthrough rates on which pages. This data can help you determine good spots for ad units in the layout of your website.
The AdSense dashboard can provide some of these statistics but it is not perfect. The Analytics software is designed to check against traffic and you may be surprised at the quality of information.
If you have never used AdSense I wouldn’t recommend making an account just for this feature. But if you are an existing advertiser the perks are worth the setup time.

15. Analyzing In-Page Content
Aside from the flow charts this feature has to be my other potential favorite. I never knew about the page analytics data up until a few months ago.
Google will actually fetch your entire homepage layout and display tooltips for the percentage of clicks from users. This is another visual graphic which may provide more value than the mathematical graph plots.
You may be surprised at the number of data stats that are pulled into this one graphic. Analytics will offer solid tracking numbers above the page preview which extends to your overall ratings.

This feature is a bit of a novelty once you have played with it often enough. It certainly has a type and it does put the traffic flow into better perspective. Also check out the options in the top right corner where you can apply background colors and determine average browser window sizes.
16. Custom Website Searches
Believe it or not Google Analytics will allow you to implement traffic data for your own custom website search. WordPress immediately comes to mind as one of the most popular CMS engines released pre-packaged with a search feature.
Note that you will need to setup the search functionality to connect to Google Analytics; I found this handy Google support article which may be helpful in the process.
When I first noticed this feature my assumption was that very few users were accessing the search on my website. But I was dead wrong, and ironically a lot of pageviews on our older blog posts were driven through the website search.
Internet marketers often deduce that Google will accommodate a user’s need to search for content. But if you are offering this feature it may be worth tracking which keywords are most popular on your site and how many visitors are finding search results helpful.
You may even consider redesigning the search results page using A/B split testing.
17. Visitor Frequency
The type of content published on your site will greatly affect how many people are coming back to use it. If there is nothing for user interaction then most visitors will only stick around for the content they care about. But this is another scenario where we are looking at bar graphs of individual trends, and not daily traffic stats.
You want to compare both the unique visits and pageviews to see if returning visitors are frequently coming back to multiple pages. You may notice the number of views dwindle towards the middle and pick up again as the “Count of Visits” increases.
Visitor trends are not something you can directly manipulate aside from marketing towards a more targeted audience. Keep those who hold a genuine interest towards your defined niche coming back to your website and these numbers will increase.

18. Looking into Mobile Visitors
Mobile traffic may take up a lot more of your website sources than you may believe. More people than ever before are accessing the Internet on their smartphones and tablets.
The Google Analytics mobile section will define which visitors are using which devices to access your website. This also includes their average pageviews and time on the website, plus the other metrics we all know and love.
But my personal favorite extra feature of this page are the device photos. When Analytics recognizes a device OS it will include a set of photos which you can see by clicking on the camera icon located in the same row. This will help if you are unfamiliar with the device style or what type of web browsers it can run.
Plus if your site is designed responsive or for retina screens, you may notice higher numbers of visitors coming back from the same mobile devices.
19. Page-Specific Metrics
I feel the content pages are some of the most important pieces of information you can study. This feature will list your most viewed webpages from top to bottom, including visitor’s time on each page and bounce rates.
You should definitely adjust the date range to go back 3 or 4 months and pick up on various overarching trends.
Sometimes you wouldn’t notice that a certain post or page is getting as much attention until you see the numbers listed out. And by going back over 6+ months it is easier to see recurring trends which you may capitalize on when writing future content.
You want to provide readers with information they care about while also using snappy headlines which would catch your attention in Google search results. Keep on top of your most popular webpages and you will quickly learn which content is driving attention to your website.

20. Analytics in Real-Time
I may have saved the best for last with the Google Analytics Real-Time tracking page. I only saw this feature a month or two back and it nearly blew my mind.
I had no idea that Google was literally tracking my visitors in real-time (Real-Time > Overview) and displaying these results to me. The whole thing is pretty addictive to be honest; you might find yourself wasting time looking at the stats the whole day!
But this webpage sincerely offers a deeper insight towards studying your visitor’s interactions on the site. At any point during the day or night you can see who is viewing your website and what pages they are looking at.
You will also find graphs for their referrals or keywords from Google. And if you scroll way down to the bottom of the page you will see a world map locating where each user is browsing from. The data itself cannot help you put together long-term results but it definitely provides a glimpse into the daily life of your website.
I want all of these various metrics to come together as one insightful guide towards looking deeper into Google Analytics data. The best way to realize what you are doing wrong is to study the patterns of your visitors and see what problems they are running into. I believe many of these reports and live tools will help.
Related Links
Additionally I have provided some related links on the topic of studying Google Analytics data for marketing and non-technical users.
- Google Analytics Tips: 10 Data Analysis Strategies That Pay Off Big
- Analytics Case Studies And Success Stories
- Google Analytics – Advanced Tips for the Non-Technical User
- Overcome the Google Analytics Learning Curve in 20 Minutes
- Google Analytics for Public Relations
Closing Thoughts
This isn’t an exhaustive list of mastering Google Analytics but I feel I have dug deeper into the more important concepts. Webmasters who are familiar with Analytics may have been checking these fields all along. And be sure that you keep it up well into the future too!
Spending time to look deeper into the data and plan a strategy for solving UI problems require solid focus and a great effort.