How to Track Your Email Statistics with Gmail Meter
In an era where understanding web and app usage is crucial for enhancing products, email statistics remain a fundamental, yet often overlooked, tool. These insights can greatly improve user engagement and interaction.
While most major email newsletter services offer detailed stats and analytics to optimize sending times and content preferences, Gmail lacked these features – until the introduction of Gmail Meter.
Gmail Meter is a powerful script that provides insights into your email habits, helping you discover top interactors, busiest email times, and more. This guide will show you how to set up Gmail Meter and start receiving insightful monthly reports.
How to Make Your Gmail Account Safer
Unlock essential Gmail security tips to safeguard your online identity. From 2-Step Verification to spotting suspicious emails, ensure... Read more
Set Up Your Gmail Stats
To begin, navigate to the Google Docs homepage and create a new spreadsheet. Click Create and choose Spreadsheet.

Next, click on the document title to rename it.
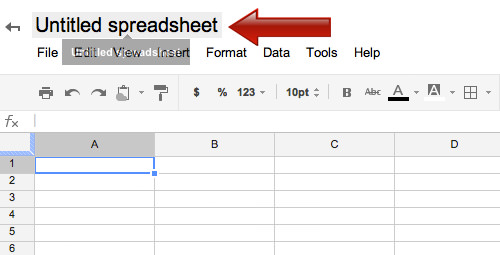
Rename your document to Gmail Meter and confirm by clicking OK.

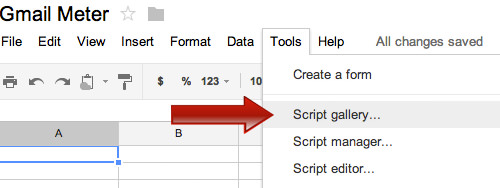
Go to Tools and open the Script Gallery.
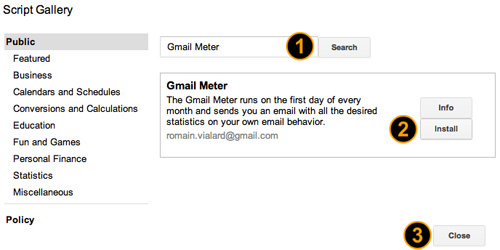
Search for Gmail Meter, click Install on the appropriate result, and then Close the window.
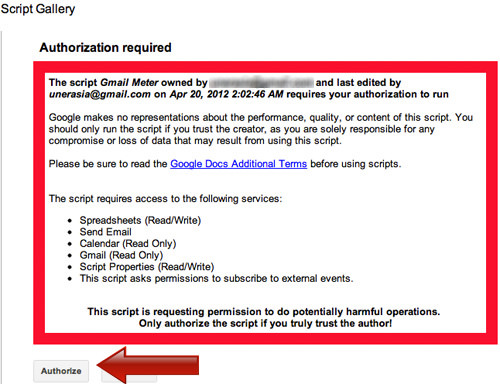
Authorize the script when prompted and close the installation window.
How to Request a Gmail Stats Report
After installation, find Gmail Meter in the menu bar and select Get A Report.

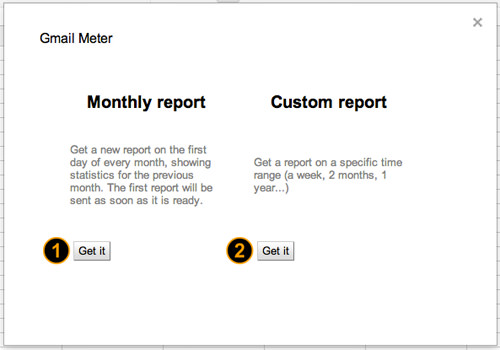
Choose either a monthly report or a custom report based on your needs.
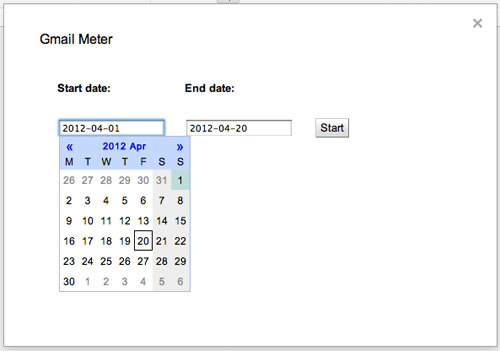
If opting for a custom report, specify the date range and click Start.
After your request, wait for Gmail Meter to generate your report.
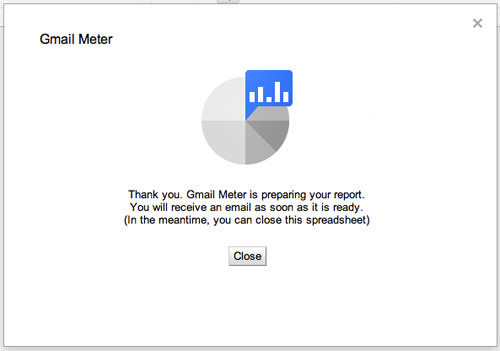
The preparation might take a while, so check your email periodically.
Interpreting Your Gmail Stats Report
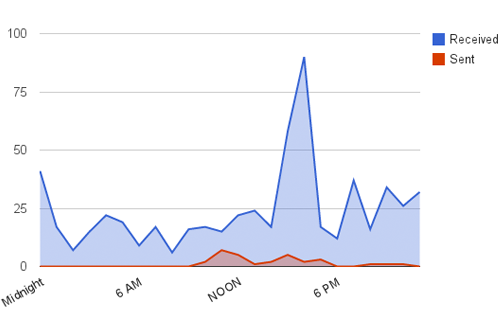
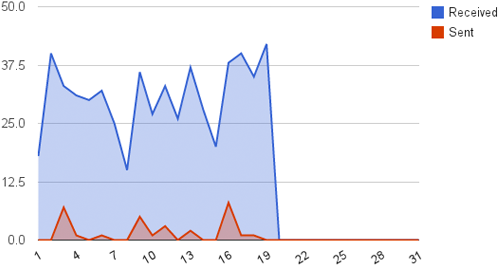
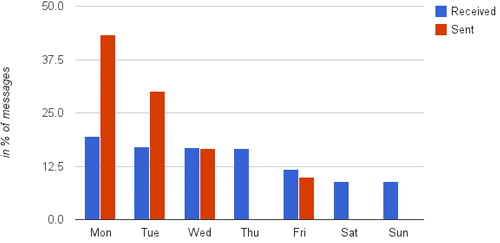
Once the report is ready, it will be emailed to you with detailed charts and graphs showing email volume, frequency, and key contacts.
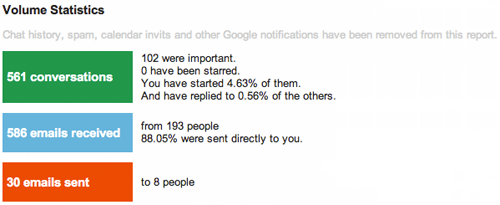
Daily, monthly, and weekly statistics are provided to offer a comprehensive view.
Conclusion
Explore the full depth of your email interactions with the raw data provided at the end of each report, and even craft your own analyses to delve deeper into your communication patterns.