A Look Into: Cohort Analysis in Google Analytics
Google Analytics stands out as a go-to tool for webmasters aiming to leverage analytics for insightful decision-making. Among its suite of features, the Cohort Analysis Report is a recent addition that has caught the attention of many.
This report is a goldmine for business owners, offering insights into customer behavior and strategies on boosting customer retention to drive profits. While the prospect of diving into this analysis may be tempting due to the valuable business intelligence it promises, a more measured approach is advisable.
In this post, which is the first in a two-part series, we’ll cover the basics of the Cohort Analysis feature in Google Analytics. We’ll explore how it combines data to reveal insights and discuss strategies for preparing and conducting your cohort analysis effectively, with the aim of achieving tangible business benefits. In our next installment, we’ll delve into the practical steps of conducting a cohort analysis focused on business outcomes.
What is Cohort Analysis?
Let’s start with the basics: a cohort refers to a group, segment, or category of objects that share common behaviors, attributes, or experiences within a specified timeframe.
Therefore, cohort analysis involves analyzing the behavior of a specific group over time. For instance, calculating the average income of employees from a particular company over a four-year period post-recruitment is an example of cohort analysis.
Despite the praise for Google Analytics’ advanced features, its initial omission of cohort analysis functionality was a point of criticism among webmasters and analysts. Such a feature, now included, significantly enhances its utility and appeal.
Decoding the Mysteries of Raw Data
The power of cohort analysis lies in its ability to track the time-specific characteristics or attributes of users. It’s fascinating to observe that a single user’s behavior can vary significantly across different periods.
Consider this: a user may purchase product X in January and switch to product Y in February. Or, from another angle, a user might access your e-commerce site using a laptop on Monday and then revisit using a smartphone on Tuesday. This underscores the importance of timing, which is precisely what cohort analysis aims to capture.
In Google Analytics, user attributes are categorized in reports as “dimensions” such as country, city, traffic source, keyword, product, etc. This classification allows users from a specific country to be grouped into a ‘country’ cohort, while those purchasing product X are grouped into a ‘product X’ cohort.
Interestingly, the same user may belong to multiple cohorts simultaneously, depending on your data segmentation and interpretation strategies.
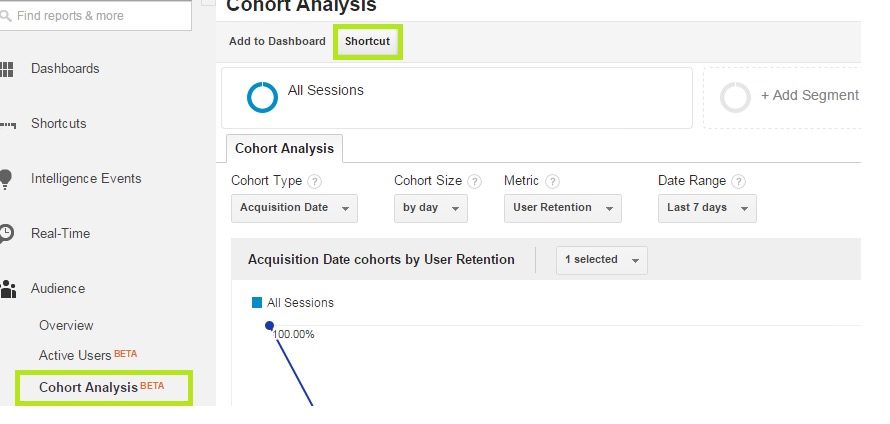
The intrigue of cohort analysis deepens when comparing different cohorts over time, revealing patterns and trends that can inform strategic decisions. This report is accessible under the Audience section, as illustrated in the following screenshot:

Mastering Cohort Analysis: A Beginner’s Guide
The undeniable business benefits derived from a comprehensive cohort analysis make it an invaluable tool, particularly for e-commerce platforms.
Websites such as Myntra and Snapdeal use it to decode user behavior and subscription trends over time. Yet, this is merely scratching the surface of its potential; a well-executed cohort analysis can unlock a treasure trove of insights.
Step 1: Formulating the Initial Question
Every cohort analysis should start with a question. Whether you’re probing the reasons behind fluctuating sales, determining the optimal timing for launching an ad, or figuring out the best moment to send out pre-holiday emails to maximize sales, the initial question sets the direction of your analysis. Deciding on your question also clarifies what you’ll be measuring.
Step 2: Identifying Core Characteristics
The next step involves pinpointing the key characteristic that defines your target cohort. This is crucial for extracting the insights you need. A well-conducted cohort analysis not only highlights but can also help you anticipate business trends, giving you a competitive edge. One of the standout features of the Cohort report in Google Analytics is its segmentation capability. By applying various segments to your analysis, you can generate distinct data tables, each offering unique insights.

Leveraging Cohort Analysis for Business Growth
Cohort analysis is invaluable for any expanding retail enterprise, offering insights into online customer behaviors that are crucial for business managers. A good starting point for studying your customers is to classify them based on their referral sources or how they discovered your business or website. Following this, you can monitor their spending over time.
A commonly performed cohort analysis involves organizing customers by their initial interaction with your business, such as their sign-up or subscription date. This approach enables you to observe spending patterns across different times, providing insights into whether the calibre of your average customer is improving or declining over time.

The Benefits of Cohort Analysis for Your Business
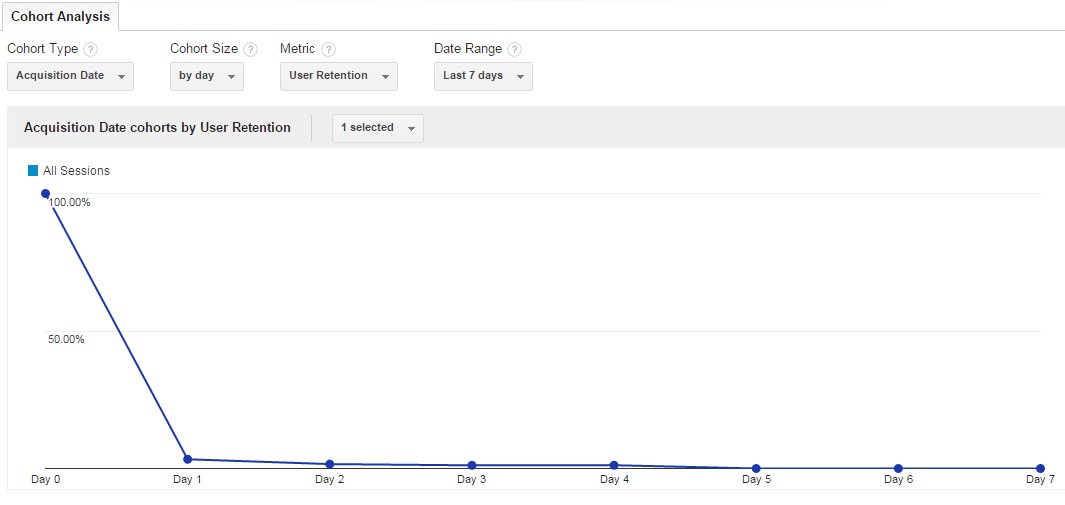
Within the realm of cohort analysis, tracking user retention emerges as a pivotal metric, particularly valuable for those looking to identify patterns in behavior over time.
Though a multitude of metrics such as goal completions, session counts, session durations, and page views are available, the following are some of the standout advantages offered by Cohort Analysis in Google Analytics:
- Google Analytics enables comparisons across different segmentation features, similar to other reports within the platform. It provides a solution gallery that users can incorporate into their analyses, facilitating the adoption of strategies developed by peers.
- The results of your analysis will be displayed in a triangular table format, offering a clear view of ongoing consumer behaviors. Additionally, a timeline graph complements the table, although the table tends to be more insightful for analysts. Over time, you’ll discover innovative ways to utilize these cohort reports to your advantage.
- Cohort reports empower you to assess data from a sustainability perspective. For instance, in the event of an increase in traffic or volume, these reports can help determine if it’s attributable to a specific cohort and whether the trend is likely to continue. This makes cohort analysis an essential tool for retail businesses seeking deeper insights into customer behaviors over time.
- A precise Cohort Analysis can also aid in spotting variations in key metrics such as retention, acquisition, or engagement, against marketing trends, enabling targeted queries to your audience.
- Moreover, Google Analytics offers Shortcuts for quick access to bespoke cohort reports, significantly saving time given the typically lengthy and complex setup process. These shortcuts are readily accessible within the Google Analytics interface with just a click.
Conclusion
In conclusion, cohort analysis has emerged as an invaluable technique for gauging the performance of distinct user groups based on shared traits or characteristics.
However, it’s important to note that Google Analytics’ cohort analysis feature is still in the early stages of development. As it continues to evolve, users are encouraged to leverage their business insights, digital strategies, and analytical capabilities to distill actionable intelligence from the vast amount of data collected from their websites.
Note: This post was originally published on July 27, 2015.