20+ Useful Online Chart & Graph Generators
Most people, like me, do not understand mere numbers and statistics and for such people charts and graphs are the best and most commonly used option. They offer an effective way to visualize data and show the relationship between entities.
Creating appealing and useful graphs require two things ‐ good knowledge of statistics and a useful chart generator tool. While the former can be learned at school, for the later here are some of the best web services that allow you to create professional charts and graphs online. Let’s take a look at the list.
Read Also: 30 Templates & Vector Kits to Design Your Own Infographic
Our favourite tools…
Livegap Charts
Here is a free chart and graph maker service that offers a live preview of the chart as you add data into the spreadsheet panel or upload from MS Excel. You can choose from an array of chart types – line, bar, stacked bars, radar, pie, and doughnut. The service does not require any registration or download.

Beam
Beam offers you to create beautiful and professional charts in different shapes and colors that can be highly customized. You can share your graphs on social media or embed them in your website or blog. Your data visualizations are mobile-optimized and absolutely free to create.

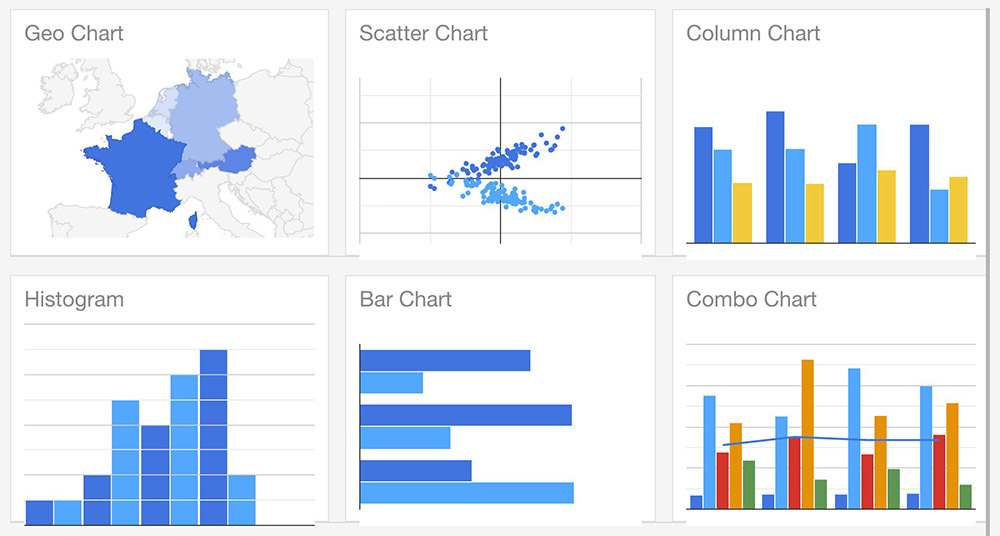
Google Charts
Google the Goliath offers services in every field and that includes data visualization. Google Charts is a free, feature-filled and totally easy to use. You can create interactive charts, choose any option from a diverse gallery and create dynamic data that updates in real-time.
Visme Graph Maker
An easy online tool to create appealing charts, graphs, and infographics, Visme Graph Maker is free and offers a gamut of features. You can create animated charts, turn reports into infographics, choose from many beautiful templates, share your data visualization online or download for offline use.

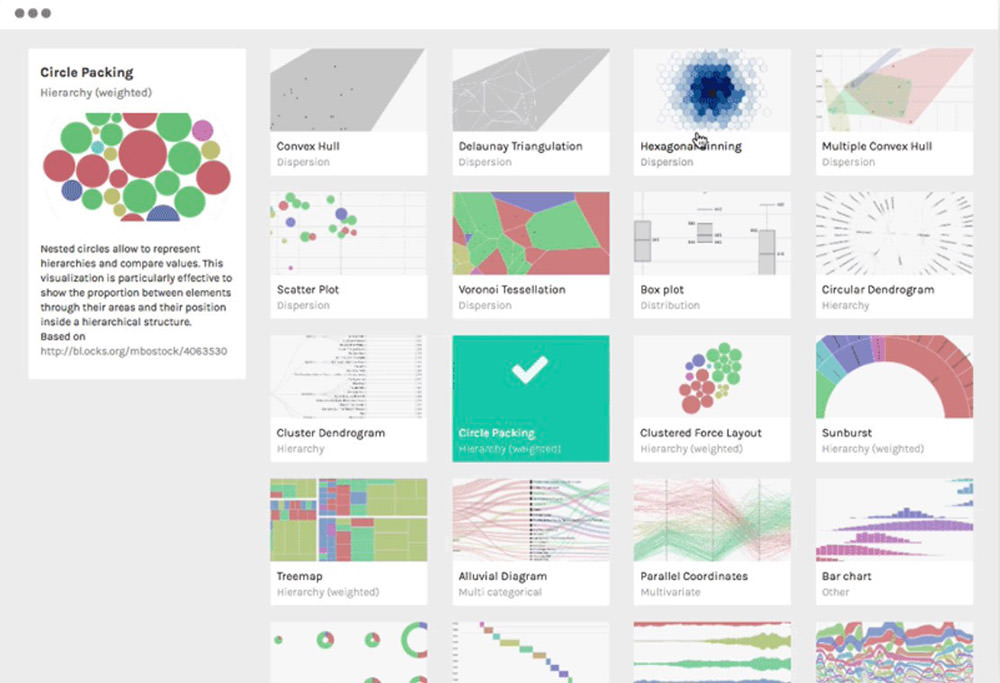
Raw Graphs
RAW Graphs can turn your plain ‘ol spreadsheet into incredible graphs and charts with only a few easy steps. Just paste your data into the web app, select a suitable visual model and create. You can check the preview and make any changes or edit and improve the created visualization in your favorite vector graphics.
Here’s more…
DIY Chart
DIY (Do it yourself) Chart is a Web-based, simple and powerful online tool to create interactive charts and graphs. You can use static or dynamic data which may be generated using any scripting language.

Online Chart Generator
It is a simple chart and graph generating online tool especially good for beginners, owing to its absolutely easy-to-use interface. You can generate amazing 3D graphs in just few seconds.

Chartle.net
Chartle.net online chart generator takes out the complexity in the process of online visualizations by offering simplicity, ubiquity and interactivity to its users.

ChartGo
ChartGo allows users to create charts online in a jiffy. Simply paste the stats in the chart data area and hit the create chart button.

Create A Graph
You can really make a detailed graph at Create A Graph and see how it might look in the preview. You can then print, download, or email what you’ve created.

JS Charts
JS Charts is a JavaScript chart generator that requires little or no coding. JS Charts allows you to easily create charts in different templates like bar charts, pie charts or simple line graphs.

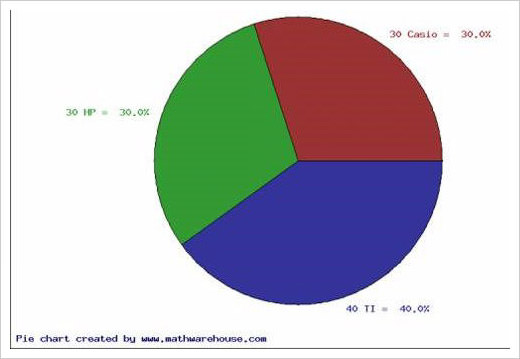
Pie Chart Tool
Pie Chart Tool creates pie charts based on the data you provide. All you have to do is to enter your data and the name of the categories in the tool and you get a nice-looking chart.

Piecolor
Piecolor is a tool that creates pie charts with different colors very easily.

Hohli Charts
Hohli Charts lets you dynamically generate charts. The charts can be created in different sizes and styles.

CHARTPART
A chart generator tool that uses Google Chart API and a very user-friendly interface to create interesting data visualization.

Chart Maker
Here is an online chart generator for the Chart Server API. Just select a type of chart, fill in the data, and click on the preview button.

amCharts Visual Editor
This editor allows you to use amCharts as a web service. This means that all you need to do is to configure the chart and paste the generated HTML code to your HTML page.

Pie Chart Maker
This free tool outputs your pie chart as an image that you can save to your computer.
ChartGizmo
With your free account from ChartGizmo you can now create charts and graphs for your website, blog or social network profiles.

Onlinecharttool.com
With Onlinecharttool.com you can design and share your own graphs online and for free.

OWTChart Generator
The OWTChart Generator is an online tool to be used to produce charts. A GIF image of the chart that you specified will be displayed on the screen.

Highcharts
Highcharts is a charting library written in pure JavaScript, offering an easy way of adding interactive charts to your web site or web application. Highcharts currently supports line, spline, area, column, bar, pie and scatter chart types.

Google Chart Generator
This Google Chart Generator can create basic charts in different visualization modes in seconds.
