A Look Into: Internet Explorer 11 DevTools
The Internet Explorer in-browser Developer Tools (IE DevTools) has long been lacking several critical functionalities for debugging, making it nearly useless. This includes the inability to inspect elements in different state like :hover, :active, :focus, and :visited – at least not in an easy intuitive way. Long story short, it is hard and frustrating to debug in Internet Explorer.
But starting with Internet Explorer 11, the IE DevTools has finally got a facelift in its existing features as well as a few new functionalities. Let’s take a look at what it now has to offer.
Recommended Reading: 5 (More) Useful Chrome DevTools Tips For Developers
Getting Started
Internet Explorer 11 is shipped along with Windows 8. If you are still using Windows 7 and haven’t yet updated IE, you can download the installer here. Launch the installer, then follow the installation instructions.
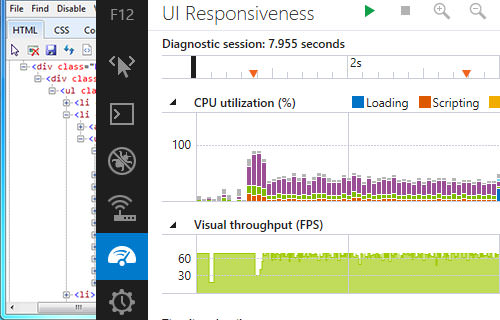
Once it has been installed, launch Internet Explorer 11, and press the F12 button to launch the DevTools. As we have mentioned and seen below, the new DevTools has a totally redesigned look, compared to earlier versions.
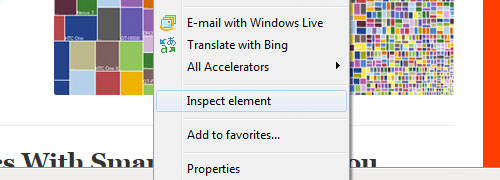
In addition, although this kind of menu has also been available in the other browsers for a while, IE 11 has also included the “Inspect Element” on the right-click menu to quickly bring up the DevTools.
DOM Explorer
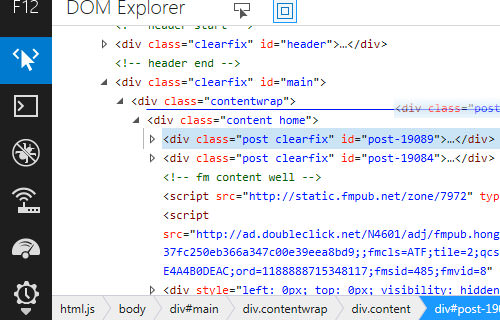
The DOM Explorer also got some improvements. First, you will find that it now has “breadcrumbs” at the bottom, which makes navigating through the DOM hierarchy much leaner. It also allows us to move elements within the DOM simply by dragging and dropping.
Styles Tab
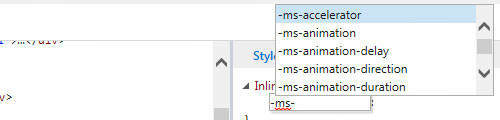
At the right side of the DOM Explorer pane, similar to the other Browsers DevTools, you will find the Styles tab with all the CSS rules that are applied to the DOM elements. It is now also equipped with Intellisense. So, as we type codes in CSS, JavaScript, and HTML, it will show a list of input suggestions to complete the code.
It now also puts the styles that are currently applied at the top, instead of buried at the very bottom (which forces us to scroll). This makes debugging CSS quicker and more intuitive.
Trace Tab
In the Trace tab, you can immediately discover which styles are applied to the element, and which styles are overridden.
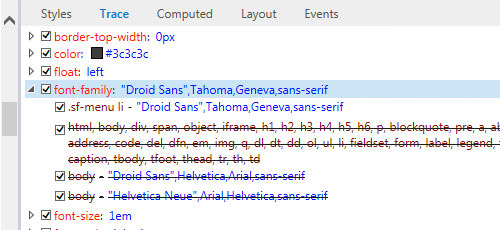
If you find your website styling output not appearing as expected, this is the tab that you should inspect.
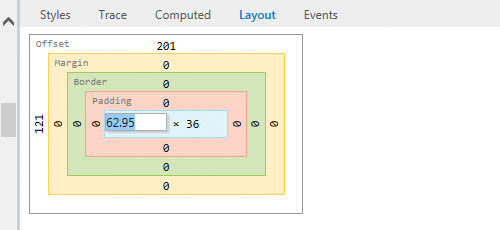
Layout Tab
Furthermore, in the Layout tab, you will also see the box diagram and box property information: width, height padding, margin and borders. Now, this tab is not merely showing information staticly, we can now also edit the values of these properties.
New Console API
Aside, from the user interface and user experience aspects, Internet Explorer 11 also introduced a number of new Console APIs including console.time and console.timeEnd method. You can use these two methods to track execution time of JavaScript functions or code blocks, for example:
console.time('loop');
var index;
var a = ["a", "b", "c"];
for (index = 0; index < a.length; ++index) {
    console.log(a[index]);
}
console.timeEnd('loop');
See the complete list of new Console API in this page.
The Mobile Emulator
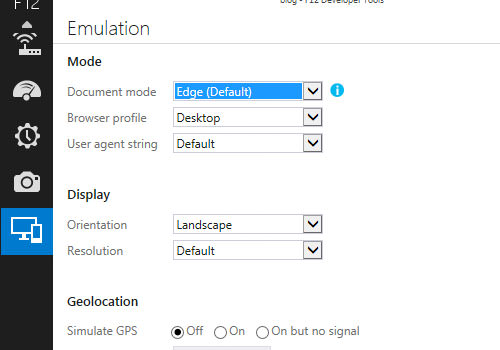
With the increasing usage of mobile devices as well as websites that are created for Mobile platforms, it is now very reasonable to include a feature in IE DevTools to support the development process. Check out the IE Mobile Emulator.
In the Emulation panel, you can configure the document and browser mode, display orientation, viewport size and Geolocation, which allows you to override your current location coordinates.
It works similar to the Emulation Tool in Chrome DevTools, so check out our previous article on 5 (More) Useful Chrome DevTools Tips For Developers.
Final Thought
Over all, I’m glad to see that Microsoft has finally put serious attention in Internet Explorer. Aside from the capability to render some cutting-edge CSS3 and HTML5 spec, the DevTools in Internet Explorer 11, as we can see above, comes with significant improvements in some areas.
However, in term of features, it still is behind the other browsers. The option for viewing elements in different state as mentioned at the beginning of the post is still missing. For those who work with CSS a lot, like me, this feature is essential.