DevTools Showdown: Edge’s F12 vs Firefox vs Chrome
The Developer Tools of Microsoft Edge, the new default browser of Windows 10 got a modern design and a few new features compared to its predecessor, Internet Explorer 11‘s F12 Dev Tools.
The question of whether Microsoft Edge’s dev tools measure up to their popular competitors – the dev tools in other modern browsers such as Mozilla Firefox and Google Chrome – naturally arises in the minds of many developers.
In this post we try to answer this question, and figure out if Edge’s F12 Dev Tools are really worth to use. We will compare its features to those of Firefox’s Developer Tools and Google Chrome’s DevTools.
How to Enable Chrome DevTools App for Remote Debugging
The Chrome DevTools App is created by Kenneth Auchenberg in an attempt to take devtools out of the... Read more
Open the Dev Tools
Pressing F12 opens the developer tools in all 3 cases: Developer Tools in Firefox, DevTools in Chrome, and F12 Dev Tools in Microsoft Edge. This is the keyboard shortcut where the official name of Edge’s F12 Dev Tools comes from.
When you open Edge’s Dev Tools you can experience at once one of its most well-known shortcomings: currently it’s impossible to pin the tools to an existing window. While you can follow what’s happening on the screen on Firefox Developer Tools and Chrome DevTools by pinning the dev tools window to the bottom of the screen, you (currently) can’t do the same with Edge.
Microsoft’s developers claim they will fix this issue in a future update.
Inspect the DOM
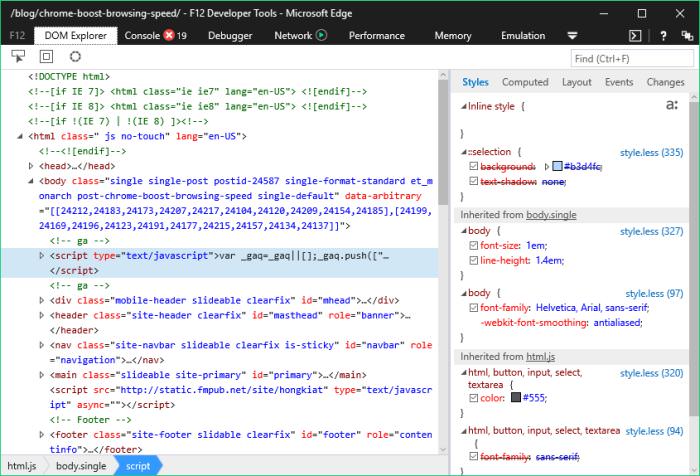
The DOM Explorer tool (Shortcut: CTRL + 1) is the first tab of Microsoft Edge’s F12 Dev Tools. Its layout and overall design is quite similar to the Element tab of Chrome and the Inspector tab in Firefox, however the capabilities sightly differ.
In Edge you can take a look at the rendered HTML document, the related CSS styles, and the event handlers registered on each element. You can also find the small graphic about the CSS box model with the computed values, already well known from the two competing browsers.
You can experiment with CSS rules by deleting current ones and adding new ones, and you can see your summarized changes on a separate subtab called “Changes” (it’s located on the left-hand side). This latter is a feature that is not built in Firefox Developer nor Chrome DevTools. It can give a quick recap to the user, so it’s a really useful option.
There are some features in Firefox Developer Tools that neither Edge, nor Google Chrome currently provide, but can significantly help the life of a designer: the Font and the Animation analyzer tools.
In Edge there’s a cool colour picker though that may somewhat compensate the user for it.
Interact with JavaScript
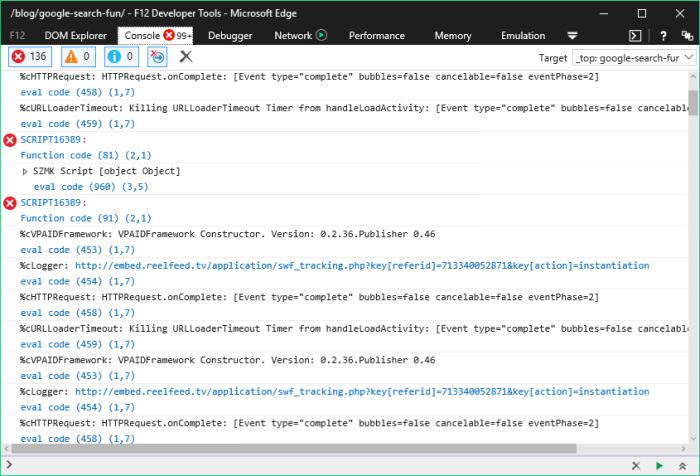
The Console tab (Shortcut: CTRL + 2) in Microsoft Edge allows you to interact with the JavaScript of your site, just like in Firefox and Chrome Dev Tools. All three allow you to follow JavaScript errors in real-time and you can also analyze them by entering your own input.
The Console tool of Edge’s F12 Dev Tools has a nice autocomplete feature that helps you with the commands, however it seems to be less knowledgeable compared to the one in Firefox and Chrome Dev Tools.
Edge separates Errors, Warnings, and Messages which is a big help, though not something that the other two toolkits don’t have.
Firefox’s Console seems to be the most professional out of the three dev tools, as it also separately shows other kind of problems: network, CSS, security errors and logging messages, and allows you to interact with these through the Console interface, not just with the JavaScript errors.
Understand What Your Code Is Doing
The Debugger tool (Shortcut: CTRL + 3) helps you understand what is happening to your code while finding potential bugs. You can set watches and breakpoints, and view call stacks.
The Watches pane displays variable values, the Callstack mode shows the chain of function calls that led to the current state, and the Breakpoints mode shows a list of the breakpoints you’ve set.
Edge’s F12 Dev Tools let you pause your code in the middle of execution, and step through it line by line. You also have the option to improve the readability of a compiled or minified JavaScript file, and you can debug different resources (JavaScript, extensions, etc.) one by one.
Firefox and Chrome DevTools provide all these functionalities, so Edge doesn’t offer an exceptional debugging experience, but it provides the user with a solid and reliable tool that is in par with its competitors.

Take A Look At The Browser-Server Communication
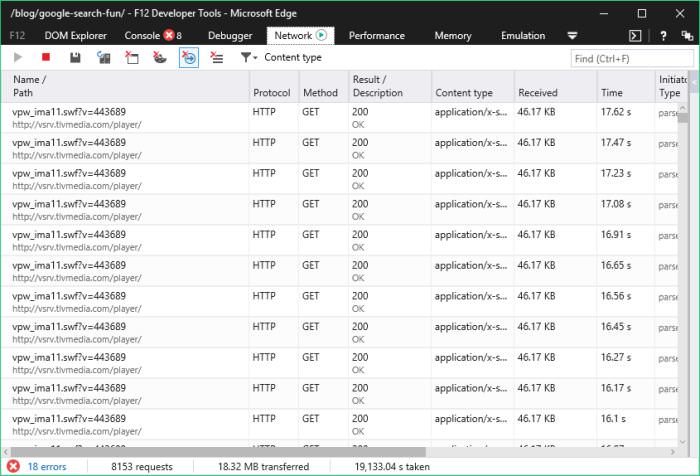
The Network tool (Shortcut: CTRL + 4) has been completely redesigned for Microsoft Edge since Internet Explorer 11. With the help of this handy tool you can follow the communication between the server and the browser, and inspect the individual requests.
You can filter the results by content type such as stylesheets, images, media, fonts, XHR, and many others. You can also debug AJAX with the help of the Network tool.
Edge’s and Firefox’s Network tab offer quite similar capabilities and user interface. Both has a user-friendly sidebar pane that allows you to take a look at the selected resource’s HTTP header, HTTP body, parameters, related cookies and timings item-by-item.
Chrome DevTools’ Network tab doesn’t have a pane like this, but if you click on the requests one-by-one you can see the same information. It’s a less intuitive solution though.
Track Down Slow Pages
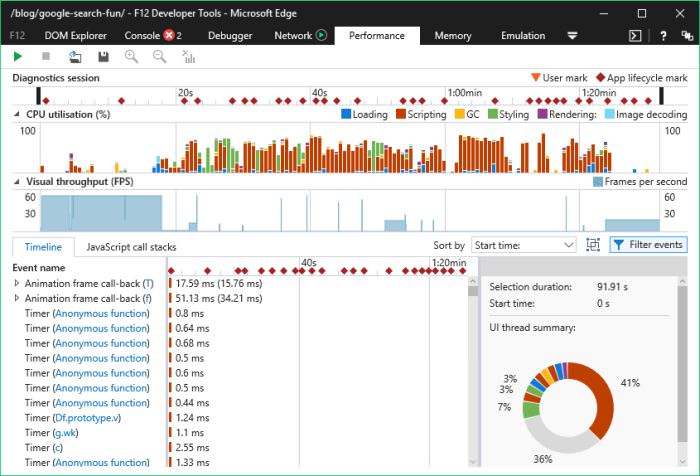
The Performance tab (Shortcut: CTRL + 5) helps you understand the reasons behind a slow web page. With the Performance tool Microsoft took a huge leap forward by combining the previous UI Responsiveness and Profiler tools to create an end-to-end view of all your scripting, and visualizing the performance.
This handy tool provides you with reports on different types of CPU usage, gives you insights into your site’s frame paint, and it’s also possible to isolate different user scenarios by setting labels on the timeline.
During the testing process we found that the Performance tool in Edge provided us with more information about speed issues than either Firefox Developer or Chrome DevTools. The user interface of the Performance tab in Edge is quite well-designed, helping us with many visual cues, and it’s relatively easy-to-use. If you want to know more about how to use it, read the detailed Docs.
Diagnose Memory Issues
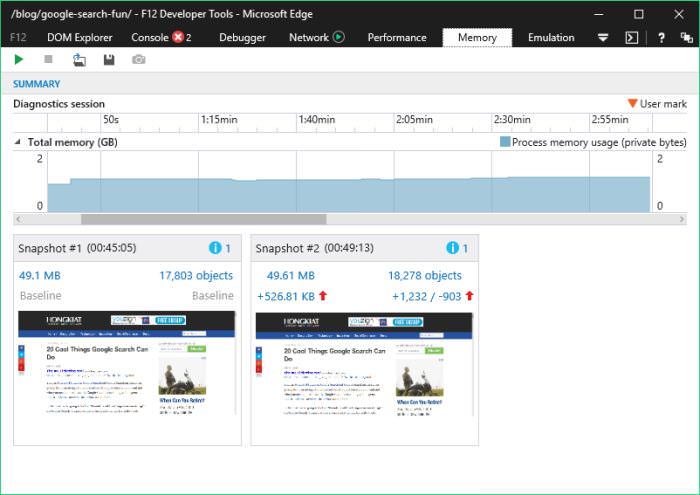
The Memory tool (Shortcut: CTRL + 6) makes it possible to find memory leaks that can also slow down your web page, moreover can impact the stability of your site.
With the help of a nice graph you can easily understand where your memory usage is growing, and you can make snapshots at specific points that make it possible to analyze the memory use. You can also compare two snapshots made at different points of the page lifecycle to understand the difference between them.
Chrome DevTools also have a nice memory profiler under the Profiles tab, while Firefox Developer doesn’t provide this feature by default, but you can download and install addons like this if you want. The memory profiler of Chrome DevTools is quite advanced and offers more features than Edge’s, for example it allows you to record JavaScript object allocations over time that can help you isolate memory leaks.
Test Your Site On Different Screen Sizes
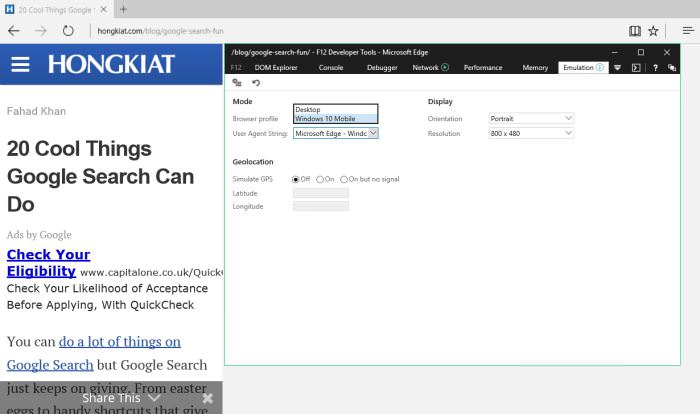
The Emulation tool (Shortcut: CTRL + 7) enables you to test your site under different circumstances. You can choose from two browser profiles, Desktop and Windows 10 Mobile, and from many different user agents including all desktop and mobile versions of Internet Explorer back to IE6, alongisde many of Edge’s competitors, Chrome, Firefox, Safari, etc.
It’s interesting that you have the option to take a look at your page as a Bing Bot. You can also emulate a GPS, and set different resolutions and orientations.
Firefox Developer Tools doesn’t have a device emulation tool, but Chrome DevTools have such a sophisticated emulator that Edge’s can hardly compete with it.
For example Chrome’s emulation screen has an accurate grid where the emulated view is inserted in, and you not only can choose from browser profiles and user agents, but also from many devices such as the different versions of iPhone or Samsung Galaxy and many others. Chrome DevTools’ emulator also has a handy Zoom option and you can test your site on different networks like 3G, 4G, DSL, WiFi, etc.
Summary
On the whole, Microsoft Edge’s F12 Dev Tools seems to be suprisingly good. It provides features quite similar to the popular web development toolkits of other modern browsers. There are two areas where Edge’s F12 Dev Tools is quite strong: the user interface that is really intuitive, user-friendly, and well-designed, and the performance diagnostic tools.
For these two features it may be worth to consider switching to, or at least testing Edge. The biggest shortcoming is the lack of the possibility to pin the dev tools to the bottom of the screen, but let’s hope Microsoft will quickly fix this issue.